Selected work / Case study
InstallerQuote
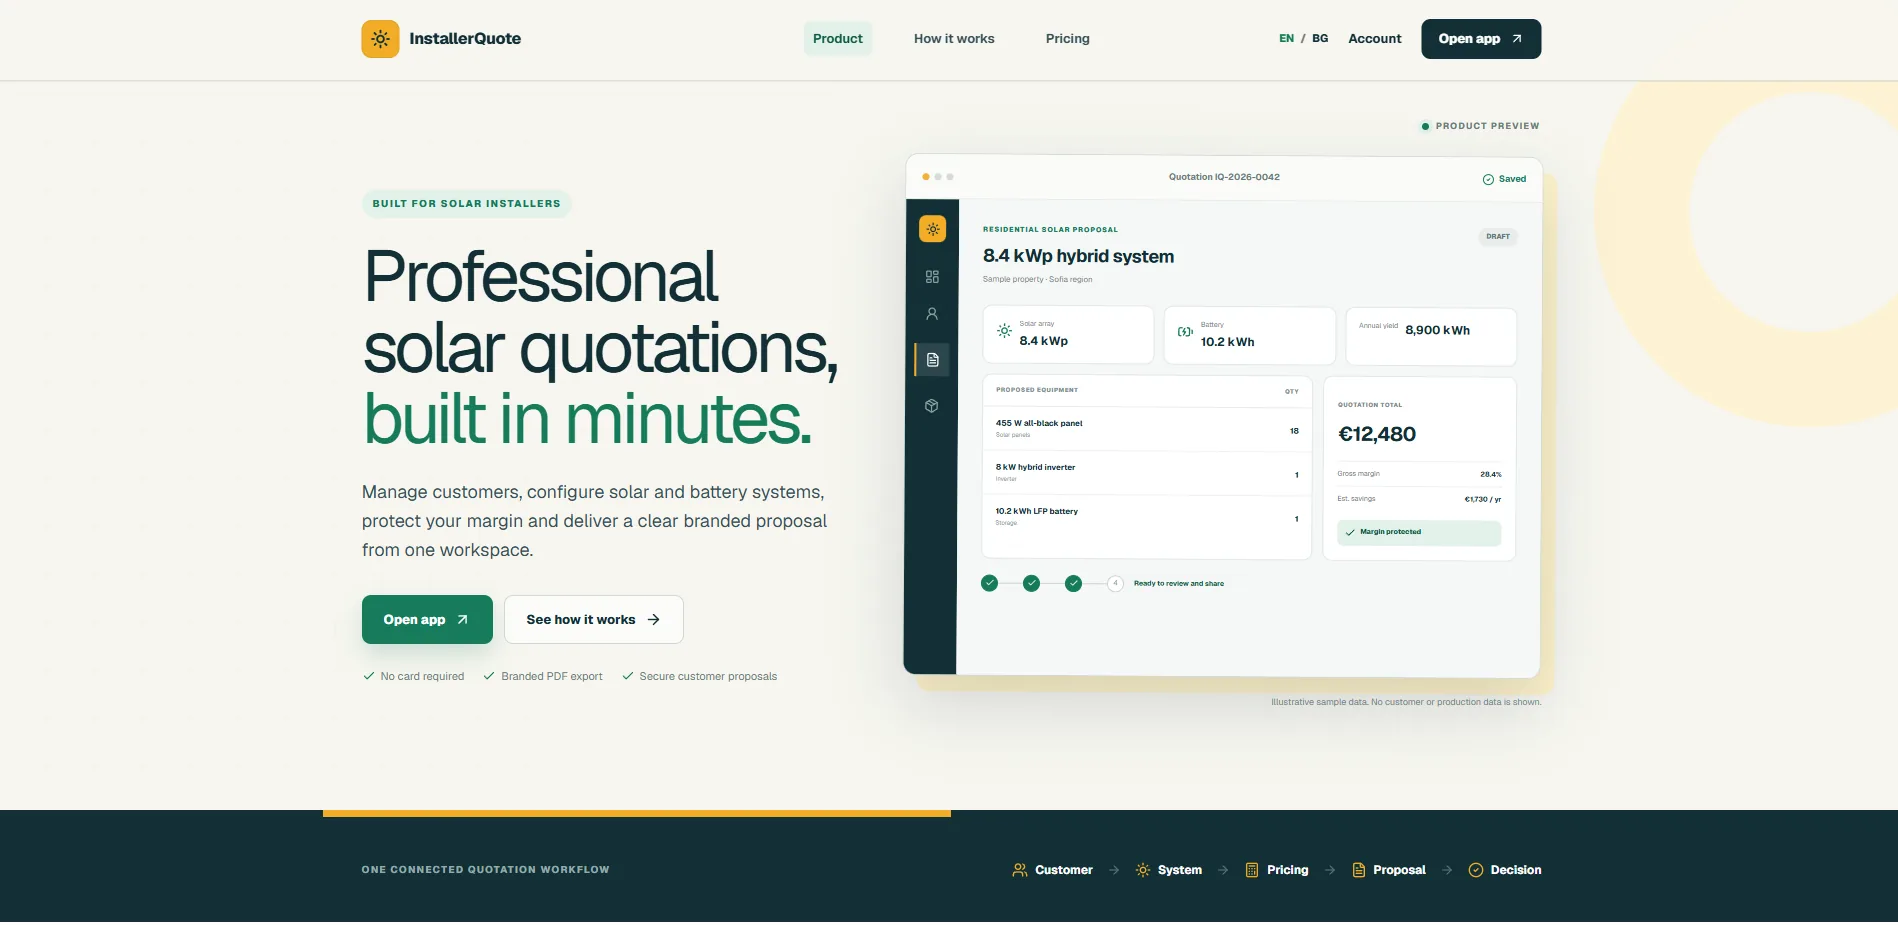
Quoting software for solar installation companies. It turns a customer's bill and roof into a sized system, a priced quote and a PDF ready to send.
01
From roof to quote
An installer's workspace holds three things: customers, an equipment catalogue and quotations. The catalogue is sorted into panels, inverters, batteries, mounting, protection, EV chargers, labour and miscellaneous items, each with a cost, a price and a tax rate.
For a new quote, the installer enters what they know about the customer: yearly consumption, how much of it happens in daylight, roof area, orientation, pitch, shading and how many hours of backup they want. The app sizes the system, then builds the line items from the catalogue:
- enough panels to reach the sized capacity, with one mounting kit per panel
- one inverter, and enough batteries to reach the sized storage
- protection gear, monitoring, and labour that grows by one unit for every eight panels
From there it's an ordinary editable quote. It moves through draft, sent, accepted, rejected or expired, and exports to PDF.

02
Sizing the installer can check
A quote is only as good as the size it starts from, and an installer won't put their name on a number they can't explain. So the sizing is deliberately simple arithmetic. All the correction factors sit in one table in the code. The assumptions that vary by region, like yield per kWp, battery efficiency and electricity price, are settings. The app also prints its reasoning next to the result.
This is the calculation for the demo's sample customer:
| Yield after corrections1,300 kWh/kWp regional yield × 0.96 south-east × 0.95 low shading × 0.994 for 28° pitch | 1,178 kWh/kWp |
|---|---|
| Solar capacity8,200 × 75% ÷ 1,178 = 5.22, rounded up to the next half kWp. The 62 m² roof allows up to 12.4 kWp, so it fits. | 5.5 kWp |
| Battery22.5 kWh a day × 62% used outside daylight (more than the 33% that 8 hours of backup needs) × 75%, divided by 90% depth of discharge × 92% efficiency, rounded up | 13 kWh |
| Yearly production5.5 kWp × 1,178 kWh/kWp | 6,482 kWh |
| Used on site38% daytime use plus 1.25 points per battery kWh, capped at 25 points | 54% |
| First-year savings3,516 kWh used on site × 0.28 per kWh | 985 a year |
Every input is clamped to a sensible range before it's used. Pitch counts from an optimum of 30° and never costs more than 18%. Systems stay between 0.8 and 100 kWp and batteries under 200 kWh. A typo in the consumption field can't turn a family home into a power plant.
03
Money never touches a float
Prices are stored as whole cents, and every sum, discount and tax runs through decimal.js. Rounding happens once, half up, at the end, so the total on screen and the total in the PDF are the same number.
Two details matter on real quotes:
- Discounts are spread across the lines in proportion to their value before tax is added. Labour and equipment can carry different tax rates, so a discount taken off the total would put the wrong tax on both.
- Margin is margin, not markup. A 25% margin on a part that costs 1,000 gives a price of 1,333.33, not 1,250. Margins are capped at 95% so the price can't divide by zero.
export function marginPriceCents(costCents: number, marginPercent: number) {
  const safeMargin = Decimal.min(95, Decimal.max(0, marginPercent));
  if (!Number.isFinite(costCents) || costCents <= 0) return 0;
  return cents(
    new Decimal(costCents).div(new Decimal(1).minus(safeMargin.div(100))),
  );
}
From src/lib/finance.ts in the demo.
04
A PDF in the customer's language
The quote the customer actually receives is an A4 PDF. It has the company header, the line items in a table, the totals, and the installer's own terms, warranty and disclaimer from their settings.
The app and the PDF both work in English and Bulgarian. The standard PDF fonts have no Cyrillic, so for a Bulgarian quote the app fetches Noto Sans and embeds it in the file. Amounts are formatted for the chosen locale and currency.
The PDF libraries load only when someone clicks export. Opening the app doesn't download them.
05
After the install
Once a system is running, the installer can log monthly production. The app totals the year so far and all time, in kWh and in money saved. It also compares the result with the original estimate, pro-rated to the months logged.
That comparison only appears after three months of data, so a single dark month can't make a healthy system look like it's failing.
06
The public demo
The product has company accounts, but nobody wants to sign up just to look. The demo is a separate static build of the same interface with a sample workspace already loaded. It has no backend and no accounts, and it saves nothing. Refresh the page and it's back to the start.
A GitHub Actions workflow builds it and publishes it to GitHub Pages on every push. All its asset paths are relative, so it runs from a subfolder without extra configuration.
07
Looking back
A few things I'd do differently next time:
- The demo's interface grew into one component of about four thousand lines. The logic underneath is already split into small modules for sizing, money, PDF and production. The screens deserve the same treatment: one module per view, each with its own state.
- The Bulgarian interface works by translating text after the page renders. It was a quick way to ship a second language, but translation keys in the components would be easier to check and harder to break.
- The sizing factors are deliberately simple. Real installers would trust them more if the app could compare its estimates with the production they log, and adjust its regional assumptions from that data.